If you’ve ever Googled “how many PS1 games are there?” and gotten answers anywhere from 2,413 to 7,900… congrats, you’ve discovered the world’s most annoying magic trick.
Same console. Same era. Same dusty gray rectangle we all blew into like that was a legitimate repair technique.
And if that giant range makes your eye twitch, let me introduce you to math’s evil twin: DEFINITIONS. Because the problem usually isn’t that people can’t count. It’s that people are counting totally different things and calling it the same thing.
So let’s make the numbers behave—at least enough that you don’t end up in a midnight spiral, whispering “real PS1 game count” into the void like it’s a haunted mirror question.
The 3 Questions That Decide Every “How Many Games?” Number
When someone throws out a game library total, it’s basically meaningless until you know how they answered these three questions.
Think of them like a “choose your own adventure,” except every page ends with you arguing with a spreadsheet.
1) Are we counting licensed games… or literally everything that shipped?
Some lists only count games that were officially licensed/approved by the platform holder. Other lists include unlicensed releases, weird variants, and things that absolutely existed in stores even if the console maker wasn’t thrilled about it.
Neither approach is “wrong.” They’re just different goals:
- If you’re doing clean historical comparisons, licensed only can be a tidy baseline.
- If you’re collecting (or suffering), “everything that shipped” is the full chaos menu.
2) Are we counting physical games only, or physical + digital?
Old school counts often ignore digital entirely (because it didn’t exist yet, or because it launched later and made everything messy). Newer databases fold digital only titles in, which suddenly makes a system look like it has a growth spurt years after launch.
This is why “PS3 had X games” arguments can get spicy. Disc totals and “total library” totals are not the same thing once digital storefronts enter the chat.
3) Are we counting globally… or by region?
This one is the king of chaos.
A game that released in Japan and North America:
- counts as one title in a “global deduped” list
- counts as two releases in a region by region list
And with older systems, regional exclusives were a whole lifestyle. Japan only titles can explode totals fast (PS1 is the poster child here). So when you see wildly different PS1 estimates, this is usually the main culprit.
Bottom line: counting is easy. “What are we counting?” is where the gremlins live.
The Backward Compatibility Trap (aka “Released For” vs “Playable On”)
Now let’s add the modern twist that makes quick comparison charts basically useless unless they explain themselves.
When someone says, “How many games does PS5 have?” they might mean either:
- Native releases only (games built specifically for PS5): roughly 1,084 depending on the cutoff date and how cross gen titles get categorized.
- Playable library (what you can actually play on the machine): 9,000+ because PS5 runs almost the entire PS4 catalog.
Xbox has the same issue: native Series X|S releases are one number, but “playable via backward compatibility plus Game Pass and older libraries” is a much bigger number.
So if you ever see a chart that doesn’t say whether it means released for or playable on, you are allowed nay, encouraged to give it a serious side eye.
(Your future self is watching. And judging.)
Okay, But What Actually Determines How Big a Console Library Gets?
Once you know the definition traps, you start noticing something else: library size isn’t just “this console was popular.” It’s shaped by boring real world forces that are basically the gaming equivalent of: “Can I afford to build this deck, or am I eating ramen for two months?”
Here are the big ones.
Media format economics (aka cartridges = smaller libraries)
Cartridges tend to mean smaller libraries than discs. Why? Manufacturing.
If it costs $15+ per unit to produce a cartridge versus under $3 for a disc, a whole category of mid tier “sure, why not” games stops being financially possible.
This is why the Nintendo 64 ended up with a much smaller library than the original PlayStation. It wasn’t a moral failing. It was math with a price tag.
Publishing barriers (velvet rope vs open door)
Some platforms make it easy for small studios to publish. Others are stricter. Steam is famously “door’s open, come on in,” while console storefronts vary depending on policies and eras.
And yes this directly changes library size. If your platform has low friction, you get a firehose of releases. If it’s tightly curated, the total stays smaller.
Regional exclusivity (especially pre-internet)
Before digital distribution, localization was slow and expensive. Japan only releases were common, and Western releases lagged or never happened.
So if you’re only counting North American titles for older systems, you’re basically looking at the “highlights reel,” not the full season.
Dev cycles getting longer (AAA takes forever now)
AAA budgets and timelines have ballooned. Think: PS1 era budgets in the $2-$5 million range vs modern $50-$100+ million (often more), and timelines stretching from 1-2 years to 4-6.
So you may get fewer giant tentpole releases in a given year than you did in some older generations.
Longer console lifespans (more years = more releases)
Consoles also stick around longer now often 7-10 years instead of 4-5. That gives libraries more time to grow, even if individual games take longer to make.
My favorite takeaway (because it’s rude but true): game counts are just definitions in a trench coat.
Modern Platforms: Why Steam Looks Like a Bottomless Pit
Here’s where people get whiplash.
If you compare “native titles released for the platform,” you get numbers like:
- Steam (PC): ~80,000 total games, with 14,535 new releases in 2023
- Nintendo Switch: ~11,600 total, 2,608 new releases in 2023
- PlayStation 4/5 combined: ~7,288 total, 1,335 new releases in 2023
- Xbox One/Series X|S combined: ~5,808 total, 945 new releases in 2023
Steam “wins” because the barrier to entry is low (that $100 submission fee is not exactly a drawbridge). The result is something like ~38 games landing on Steam daily.
Daily.
Your backlog just sat up and started breathing heavily.
And console platforms? Their totals are shaped by policies. For example, PlayStation’s lower count in recent years isn’t automatically a “slowdown” Sony tightened rules around 2022-2023, pushed back on trophy shovelware, and rejected more low effort submissions. A drop can be policy, not momentum.
A Quick Look Back: Why Older Libraries Have Those Wild Ranges
You don’t need every number for every console (unless you collect trivia like it’s currency), but seeing the pattern helps.
Here are a few “ohhh that’s why” examples:
- PS1: the famous “2,413 to 7,900” spread is mostly regional counting (especially Japan only titles) plus what’s considered “official.”
- PS2: often cited anywhere from 2,501 to 4,000+ depending on region scope.
- PS3: people cite around 2,241 total (with splits like 1,432 physical + 809 digital only) a perfect example of the physical to digital transition changing the math.
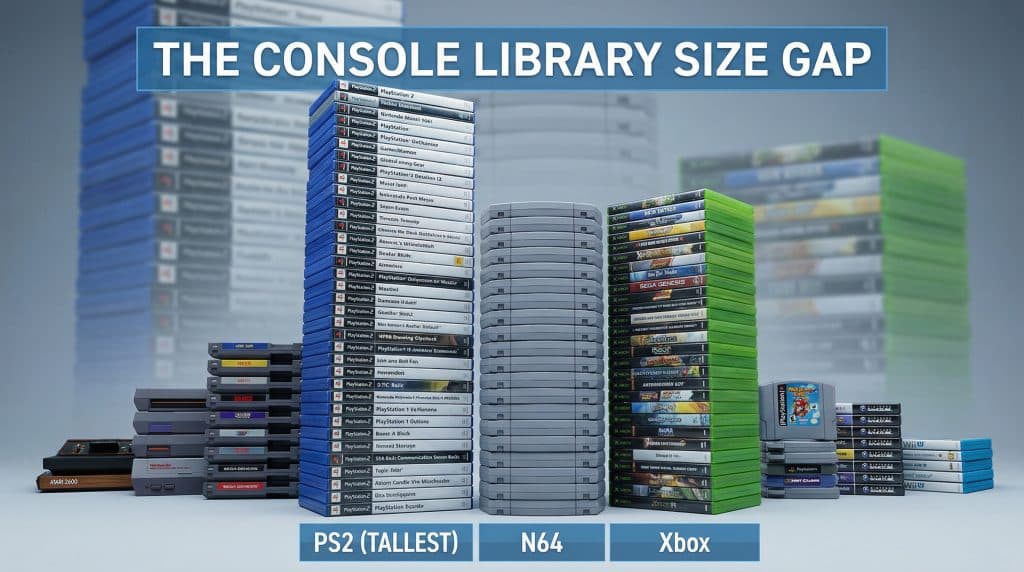
Nintendo gives you the cleanest “format matters” case study:
- N64: about 388 games (cartridges, expensive, smaller library)
- PS1: thousands (CDs, cheaper, bigger library)
And then there are the “region gap” classics:
- Sega Saturn: cited anywhere from 597 to 1,757 because Japan had a much deeper catalog than North America.
- Xbox 360: massive swings (1,741 to 4,800) depending on whether digital releases like Xbox Live Arcade are included.
Same story every time: region rules + digital inclusion = range.
Digital Distribution Blew the Roof Off (In Both Good and Bad Ways)
Once digital storefronts became dominant, physical retail stopped being the gatekeeper.
A PS2 game like classic PS2 titles to play needed shelf space at a store. A PS5 game needs… a store page and enough willpower to submit the right file format.
With around 95% of sales now digital, it’s just easier to release games and harder to stand out next to top selling console hits. And with self-publishing programs rolling in around 2014-2016, indie releases exploded. By sheer title count, a big chunk of modern console libraries (often cited around 60-70%) is indie.
That’s not a complaint, by the way. I love indies. I just also acknowledge that an “endless library” is not the same thing as “endless good options I will actually play.”
Which brings me to…
When Bigger Libraries Backfire (aka The 47 Page Menu Problem)
Somewhere around a few thousand titles, “bigger library” stops feeling like a flex and starts feeling like walking into a restaurant with a menu the size of a phone book.
You’re not impressed. You’re tired.
On Steam, discovery becomes the problem. Discounts and algorithms end up deciding what gets seen. New games fight both other new games and older discounted stuff, so a lot of players wait for sales unless something is already proven.
On Switch, the catalog is huge, but attention clusters around first party titles and a handful of well known indie hits. Plenty of games launch to a gentle whisper and then… vanish.
And here’s the reality check I think more people need: most players don’t play 11,600 games. Switch owners average something like 8.3 games purchased within four years. Most of us spend real time with maybe 20-40 games per generation.
So yes: more games doesn’t automatically mean more good games or more games you’ll actually touch.
Where to Find Numbers That Won’t Embarrass You Later
The internet loves a confident number. Even if it’s wrong. Especially if it’s wrong.
So here’s my low drama approach:
Good places to start:
- official platform holder statements (when they exist and are clear)
- long running publications that track milestones over time
- specialist databases (for example, sources like The MagicBox for translated Japanese totals)
Use caution with:
- user edited lists with unclear rules
- retailer catalogs (they often include placeholders, duplicates, unreleased items)
- sites that copy press releases without explaining methodology
My 2 minute “Don’t Get Fooled” checklist
Before you quote a number like it’s carved into stone:
1) Check two sources (one mainstream, one specialist if possible).
2) Look for the method (region? physical only? digital included?).
3) If they don’t match, don’t panic compare what each one is counting.
That alone eliminates like 90% of the “wait, what?” moments.
Pick the Metric Based on What You’re Trying to Do
This is the part people skip, and then everyone ends up in the comments section throwing numbers like dodgeballs.
Ask yourself: Why do I want this number?
- If you want historical comparisons (especially older generations), go more conservative: licensed retail, clear region rules.
- If you want regional analysis, count physical releases by region and expect the totals to jump.
- If you want modern comparisons, you basically have to include digital or you’re not describing reality.
- If you want “what can I actually play?”, use playable library numbers (and be explicit about backward compatibility).
If you want a clean answer you can defend at a dinner party
(Or, more realistically, in a group chat.)
1) Pick your purpose.
2) Define your terms: “released for” vs “playable on,” region rules, physical vs digital.
3) Pull at least two sources that explain what they count.
4) Report a range if needed, and note the date/method.
And just like that, you’re no longer arguing with ghosts.
Stop Hunting “One True Number”
Game library counts fluctuate because they’re built on definitions, not just arithmetic. Manufacturing costs, publishing policies, regional releases, and distribution methods shape catalog size way more than nostalgia wants to admit.
So instead of looking for one perfect number, look for a clear, well labeled number:
- what it includes
- what it excludes
- what region(s) it covers
- what date it’s current to
Do that, and conflicting stats stop looking like “someone is lying” and start looking like what they really are: different slices of the same messy history.
Now go count something and make the definitions behave.